FloEdge Indicator TradingView

Automatic support & resistance · zone strength · alerts · TradingView

  • Payment through TradingView at launch
  • Indicator and 4 strategies included
  • Coming soon to the TradingView Marketplace
TradingView
Payment at launch
5
Scripts included in the subscription
5 min
Optimized timeframe
Auto
Zones drawn and cleared on their own

FloEdge Indicator
in 20 seconds

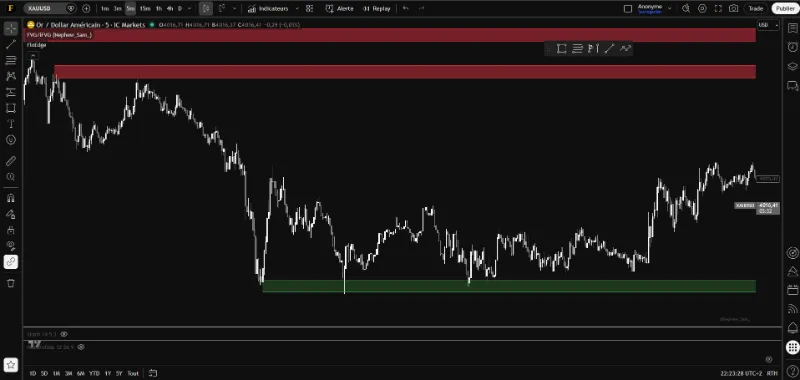
A real gold session on the 5-minute chart (October 19, 2026), replayed in fast motion: the zones draw themselves, a broken zone disappears, a new resistance zone appears, then price bounces off support.

  • Support and resistance detected automatically
  • Broken zones removed: the chart stays easy to read
  • No duplicates: levels that are too close together are filtered out

Real example, for illustration only: a zone does not guarantee a bounce. Video captions in French.

See FloEdge Indicator
in action

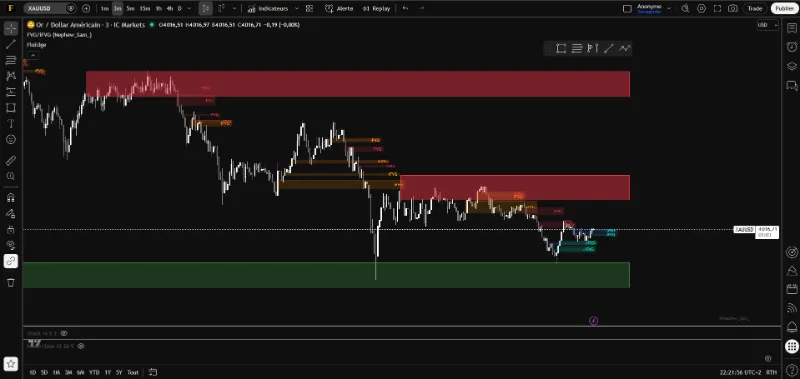
Watch how the indicator automatically draws the key zones from significant swing highs and lows, in real time on the chart.

  • Support (green) and Resistance (red) zones drawn automatically
  • Exact price shown at every swing high or low that creates a zone
  • Zones extended candle after candle as long as no close breaks them
  • Broken zones removed in real time to keep the chart clean
1 minute
To understand the tool
0
Zones to draw by hand
100%
Automatic & real-time
FloEdge Indicator · 5 zones replayed on TradingView Bar Replay
Selected examples replayed in Bar Replay · a zone does not guarantee a bounce · captions in French
Comparison

The chart before / after FloEdge

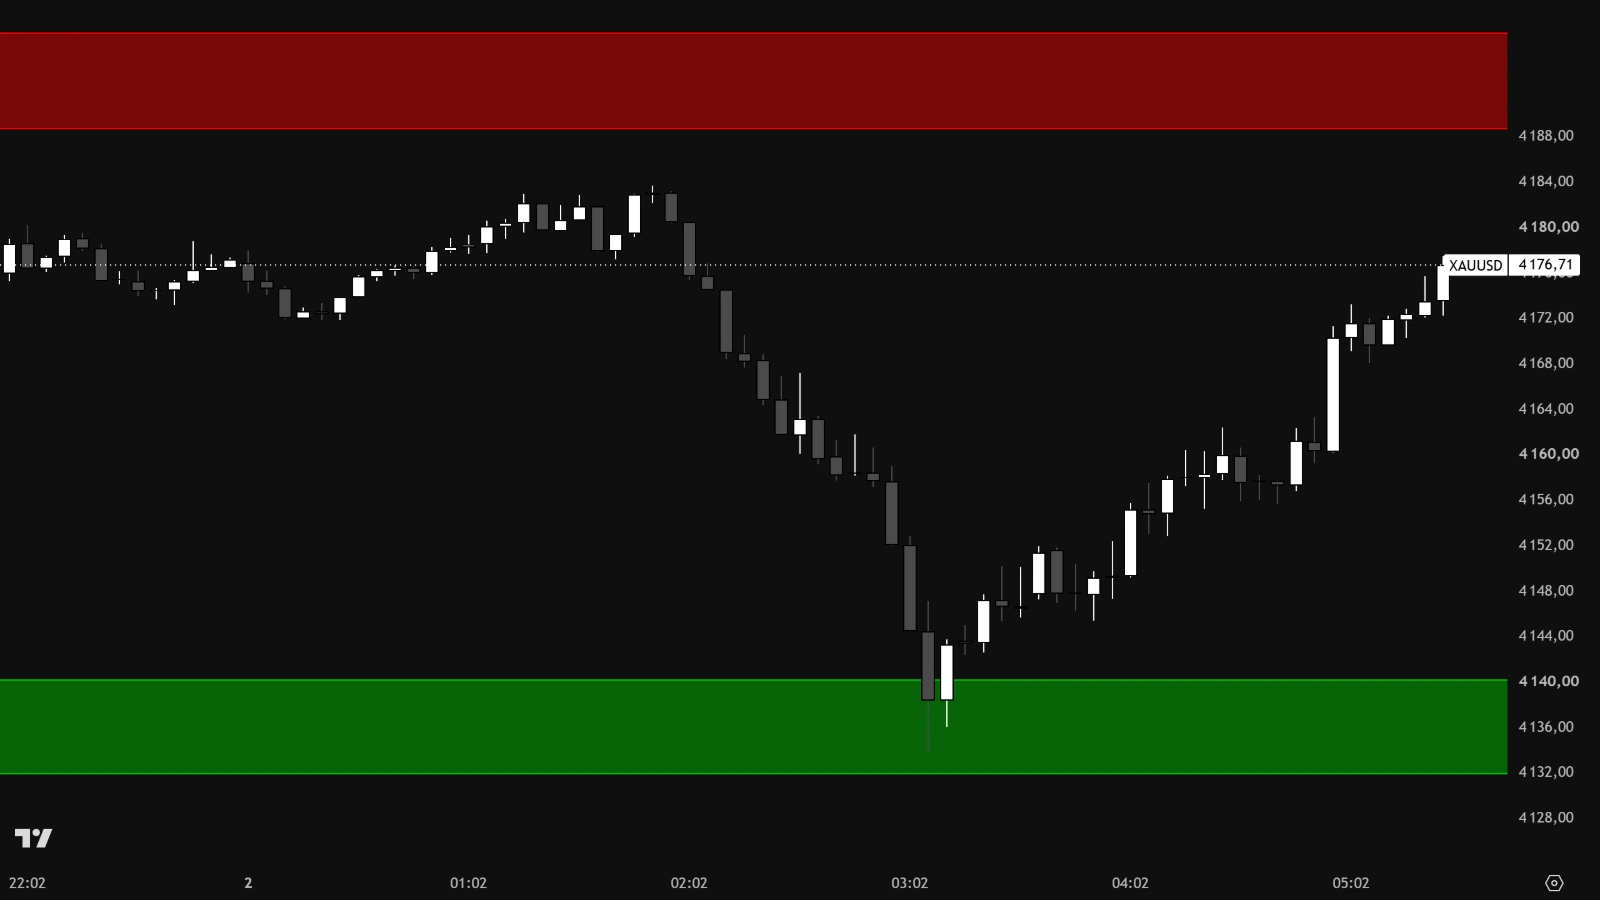
The same chart with FloEdge Indicator: the support zone that price bounces off, and a resistance zone above
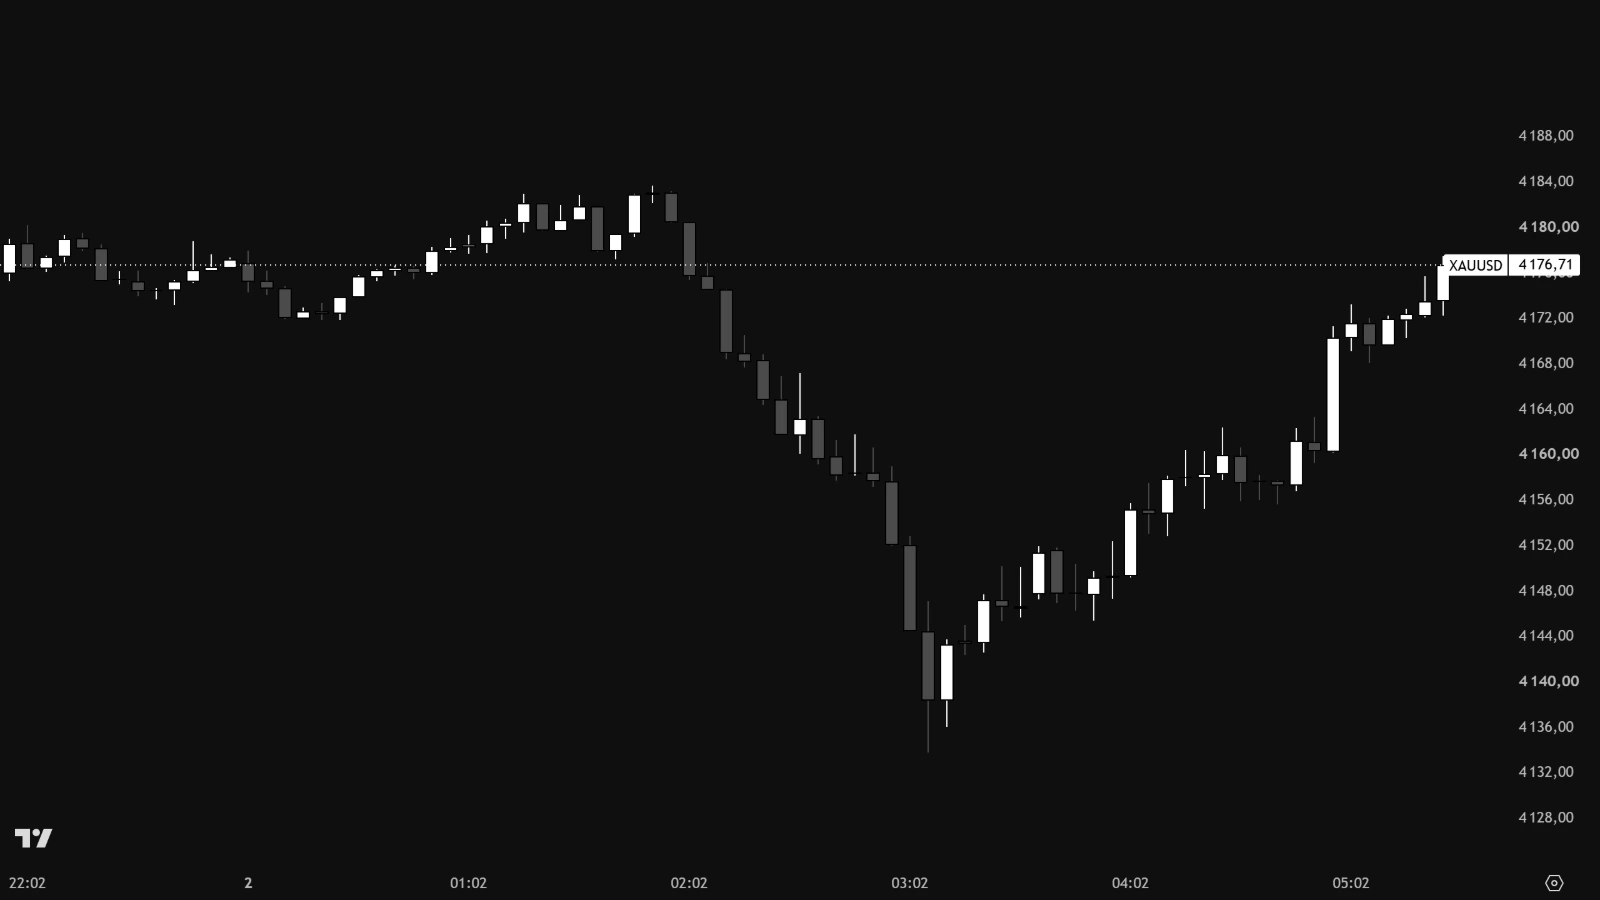
XAUUSD 5-minute chart, night of October 1–2, 2026, with no indicator
◀▶
Before
After
← Drag to compare →

Real example on the XAUUSD 5-minute chart, on the night of October 1–2, 2026: gold drops nearly $50 in an hour, stalls in the support zone drawn by FloEdge, then climbs back more than $40. A zone does not guarantee a bounce: some get broken.

Everything you need
in one tool

Automatic S/R zones
Algorithmic detection of significant pivot highs and lows. Zones are drawn automatically as rectangles on your chart, with no manual input at all.
Zone strength
Each zone counts its bounces: price comes back into the zone, then moves away on the correct side, with no close beyond it. The count appears on the label (×3), and the border gets thicker once the zone reaches 3 bounces.
Price of each pivot
Every swing high or low that creates a zone is marked with a label showing its exact price, which disappears along with the zone. You always know where a zone comes from (labels can be turned off).
Zones extended in real time
Each zone starts at the pivot that created it and stretches to the right with every new candle. No more than 5 support and 5 resistance zones on screen (adjustable up to 15).
Merging of nearby zones
A new swing high or low that is too close to an existing zone on the same side is ignored (the “Fusion zones proches” setting, for merging nearby zones), so there are no duplicates and no visual noise.
Automatic removal of broken zones
As soon as a candle closes beyond a zone, the zone and its label disappear from the chart (a wick is not enough). Your analysis stays clean in real time.
Higher-timeframe zones
Optionally, zones from a higher timeframe (1 hour by default) are drawn in dashed lines on your 5-minute chart. They are calculated on closed candles only: once a zone is displayed, it no longer moves.
Built-in alerts
Get notified when price enters a zone, when a zone is broken on a candle close and, if you wish, when a new zone appears. The message tells you the zone and its bounce count.
100% customizable
Pivot sensitivity, zone width and count, spacing between zones, higher timeframe, alerts, colors, labels… Tailor every setting to your trading style.

Up and running in
4 steps

1


Subscribe on TradingView
Coming soon to the TradingView Marketplace: a single subscription, with no commitment, gives you access to the indicator and all 4 strategies.
2


Payment through TradingView at launch
At launch, TradingView will collect the payment and immediately activate access to the FloEdge scripts on your account. There is nothing else to do.
3


Add it to your chart
Open a TradingView chart and add FloEdge Indicator from the Indicators menu.
4


Trade with precision
Spot the levels where price has already reacted and their bounce count, then create your alerts to be notified when price comes back to them.

What you can check
for yourself

No commitment

You can cancel the subscription at any time from your TradingView account, and access stays active until the end of the period already paid for.

A trader, not an agency

FloEdge is designed, coded and maintained by one person: Florent, who uses it every day on XAUUSD. Your questions are answered within 24 hours, by the person who writes the code.

The same zones on your account

The screenshots and videos on this page are real TradingView charts. Once you subscribe, you can check for yourself that the zones behave the same way on your account.

Customer reviews will be published here over time, only with their authors’ written consent. No testimonial is made up.

All included,
coming soon as a TradingView subscription.

TradingView

One subscription, everything included

The FloEdge indicator and all 4 strategies, updates included. Coming soon to the TradingView Marketplace, right from your account.

  • ✓
    Payment through TradingView at launchTradingView will collect the payment: your card or bank details will never pass through flotrade.fr.
  • ✓
    Access activated automaticallyAll 5 scripts will appear in your TradingView account as soon as you subscribe, with no waiting.
  • ✓
    No commitmentCancel anytime from your TradingView account settings.

FloEdge Indicator is already published on TradingView, as an invite-only script: description, settings and example chart.

View on TradingView

Follow FloTrade on TradingView

As of October 27, 2026, flotrade.fr no longer sells access or offers free trials.
TradingView is a trademark of TradingView, Inc. FloTrade is not affiliated with TradingView.

  • ✓
    All of FloEdge includedThe indicator and the 4 strategies on your TradingView account, updates included, for as long as your subscription runs.
  • ✓
    Automatic support and resistance zonesReal-time pivot detection with colored rectangles on the chart and, optionally, zones from a higher timeframe.
  • ✓
    Broken zones cleared on the closeA wick is not enough: a zone is removed only if a candle closes beyond it.
  • ✓
    Price of each pivotA label shows the exact price of the swing high or low that created the zone.
  • ✓
    Strength of each zoneThe bounce count appears on the zone’s label.
  • ✓
    AlertsPrice in a zone, broken zone, new zone: you choose which ones you receive.
  • ✓
    Compatible with all marketsCrypto, Forex, Stocks, Indices, Commodities — it works everywhere.
  • ✓
    Updates includedFor as long as your subscription runs, you get every improvement to the indicator.

Frequently asked
questions

How do I get access to FloEdge?
The FloEdge subscription will soon be available on the TradingView Marketplace: you’ll subscribe from your TradingView account, and access to the scripts will be activated automatically. As of October 27, 2026, flotrade.fr no longer sells access or offers free trials.
What does the subscription include?
All of FloEdge: FloEdge Indicator and the 4 strategies (FloEdge S/R, FVG/iFVG, VWAP, and Scalp), with all their updates. There’s nothing else to buy.
I have no trading experience. Is it right for me?
Yes, the indicator is easy to get started with: zones appear automatically on your chart, so there is nothing for you to calculate or draw. It does not replace learning to trade, though: a zone does not guarantee a bounce, and trading carries a risk of capital loss.
Which markets does it work on?
FloEdge Indicator works on all TradingView markets: crypto, forex, stocks, indices, commodities. It is optimized for the 5-minute chart and compatible with all timeframes. The 4 strategies, however, are tuned for gold (XAUUSD).
What does “×3” next to a zone’s price mean?
It is the zone’s bounce count: price came back into the zone 3 times and left it on the correct side each time, with no close beyond it. Several consecutive candles inside the zone count as a single bounce. The zone’s border gets thicker once it reaches 3 bounces.
Can I get an alert when price touches a zone?
Yes. On TradingView, create an alert on FloEdge Indicator with the condition “Any alert() function call”: you are notified when price enters a zone, when a zone is broken (on the candle close) and, if you enable it in the settings, when a new zone appears. The number of alerts you can have active at the same time depends on your TradingView plan.
Do I need a paid TradingView plan?
No. A free TradingView account is all you need to use FloEdge.
How will payment work?
Payment will be made directly and securely on TradingView: your bank details never pass through flotrade.fr. TradingView will show the price and any applicable taxes when you subscribe.
Can I cancel whenever I want?
Yes. You cancel the subscription from your TradingView account settings, without having to contact me. Your access stays active until the end of the period already paid for. For a subscription taken out on flotrade.fr before October 27, 2026: cancel from the Stripe customer portal (sign in by email) or by writing to support@flotrade.fr.
I have a problem with the installation. Who should I contact?
Email me at support@flotrade.fr. I reply within 24 hours and will help you until the indicator is up and running.